

Debugging HTTP 502 errors on Google Kubernetes Engine
# 27 January 2019This is a walkthrough of how I debugged and fixed intermittent HTTP 502 (Bad Gateway) errors on Google Kubernetes Engine (GKE).
Infrastructure Setup
- GKE Kubernetes cluster
- 2 Nodes
- 1 Deployment, scaled to two pods. Each pod running a single Node.js-based HTTP server application
- 1 Service
- 1 GCE Ingress. It manages Google Cloud HTTP Load Balancers via the Kubernetes Ingress API. I was using a Network Endpoint Group (NEG) as a backend, which allows pods to be connected to from the load balancer directly.


Application Server Setup
Requests resulted in HTTP 502s seemingly at random. Running the load test suite was sufficient to reproduce the issue almost every time.
The HTTP Load Balancing docs have information about timeouts and retries. The Load Balancer keeps TCP connections idle for up to 10 minutes, therefore the application server’s timeout must be longer than this to avoid race conditions. My initial Node.js code to do this was as follows, but did not resolve the issue.
// https://nodejs.org/api/http.html#http_event_connection
server.on('connection', function(socket) {
  // Set the socket timeout to 620 seconds
  socket.setTimeout(620e3);
});
Checking for Known Issues
There was an open issue on the GCE Ingress GitHub with several ideas.
Some related to switching from externalTrafficPolicy: Cluster (which is the default for services) to externalTrafficPolicy: Local. By default, the GCE ingress will create an Instance Group targeting all nodes in the cluster. Any nodes not running a pod of the target Service need to forward traffic to another node which is. Using Network Endpoint Groups avoids this situation, as the pods are directly targeted.
There were also suggestions that nodes might be being terminated while receiving traffic (common if using pre-emptible machine types). That was not the issue in my case.
Checking the Logs
Stackdriver Logging creates logs for much of Google Cloud Platform by default, including HTTP Load Balancers:
resource.type="http_load_balancer"
httpRequest.status=502
The jsonPayload.statusDetails field had the value backend_connection_closed_before_data_sent_to_client in all cases, indicating that the backend (my application) had closed the connection unexpectedly.
This was puzzling since I had set the socket timeout in my application code. I opened a telnet session in the container to the server without sending any data and it was indeed closed after 620 seconds, indicating that the TCP timeout was set correctly.
The Server’s View
To see what was happening to these failed requests from the server’s view, I installed tshark (the CLI companion to Wireshark). I scaled down the deployment to a single pod, monitored the network traffic during a load-test run, and saved the output to a pcap file. kubectl cp makes it blessedly easy to download files from Kubernetes containers. I then opened the pcap file locally in the Wireshark GUI.
Looking for HTTP 502 errors in the trace would not be fruitful, because these errors were being sent by the load balancer, not the server. I tagged each request with a random X-My-Uuid header, and logged failed UUIDs during the load-test run.
Using a failed UUID as a display filter in Wireshark let me track down one of the failed requests. I then filtered the trace to only show packets from the same TCP connection.
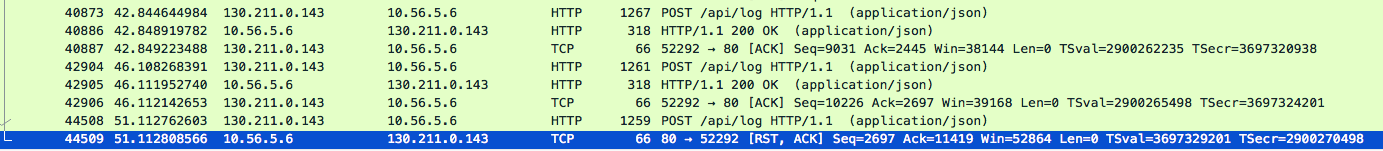
Two requests were served correctly in the space of 4 seconds. The failed request came 5 seconds later and resulted in a TCP RST from the server, closing the connection. This is the backend_connection_closed_before_data_sent_to_client seen in the Stackdriver logs.
Debugging the server and looking through the Node.js source for the HTTP server module yielded the following likely looking code in the ‘response finished’ callback:
// ...
} else if (state.outgoing.length === 0) {
    if (server.keepAliveTimeout && typeof socket.setTimeout === 'function') {
      socket.setTimeout(0);
      socket.setTimeout(server.keepAliveTimeout);
      state.keepAliveTimeoutSet = true;
    }
  }
// ...
server.keepAliveTimeout (default 5 seconds) was replacing the socket timeout I had set in the connection event listener whenever a request was received! Apparently this default keepAlive timeout was new in Node 8, there did not used to be a default timeout.
Setting the default timeout as follows resolved the issue:
server.keepAliveTimeout = 620e3;
I made a PR to the connection event listener docs to hopefully save someone some time in future.